Health System Response
| Unit | 2015 | 2016 | 2017 | 2018 | 2019 | |
|---|---|---|---|---|---|---|
| Budget of the MOPH | Billion LBP | 515.9 | 642.7 | 708.5 | 728 | 743 |
| Per capita total expenditure on health (THE) | $US | 863 | - | - | - | - |
| Out-of-pocket expenditure as % of THE | Percent | 32.7 | - | - | - | - |
| Unit | 2012 | 2013 | 2014 | 2015 | 2016 | 2017 | 2018 | 2019 | 2024 | |
|---|---|---|---|---|---|---|---|---|---|---|
| Physicians | per 10,000 population | 36.5 | 31.9 | 30.7 | 32.0 | 31.0 | 31.3 | 31.2 | 33.3 | 44.8 |
| Nursing and Midwifery | per 10,000 population | 29.1 | 33.1 | 33 | 33.4 | 34.2 | 36.4 | 37.4 | 38.6 | 63.2 |
| Dentists | per 10,000 population | 12.7 | 12.6 | 12.9 | 12.9 | 15.1 | 15.2 | 15.6 | 15.6 | 20.4 |
| Pharmacists | per 10,000 population | 18.6 | 16.8 | 17.5 | 17.7 | 18.2 | 18.9 | 19.8 | 20.3 | 28.5 |
Density per million population of high tech equipment
| High tech unit | N* |
|---|---|
| Open heart surgery departments | 27 |
| Cardiac catheterization laboratories | 59 |
| Kidney transplant centers | 8 |
| Bone marrow transplant units | 6 |
| Specialized burns centers | 3 |
| CT scan machines | 110 |
| MRI machines | 41 |
| PET scan | 7 |
| Dialysis machines | 841 |
*High tech equipment in the public and private sector
*Number as provided by the Department of Projects and Programs in 2014 pertaining to the latest available figures (2012)
*Number as provided by the Department of Projects and Programs in 2014 pertaining to the latest available figures (2012)
National immunization coverage rates by polio, measles and pentavalent vaccines, 2012-2017
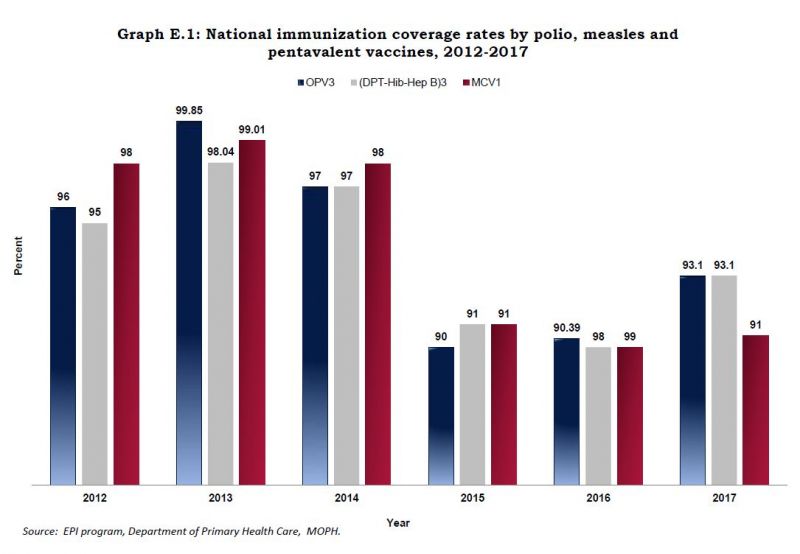
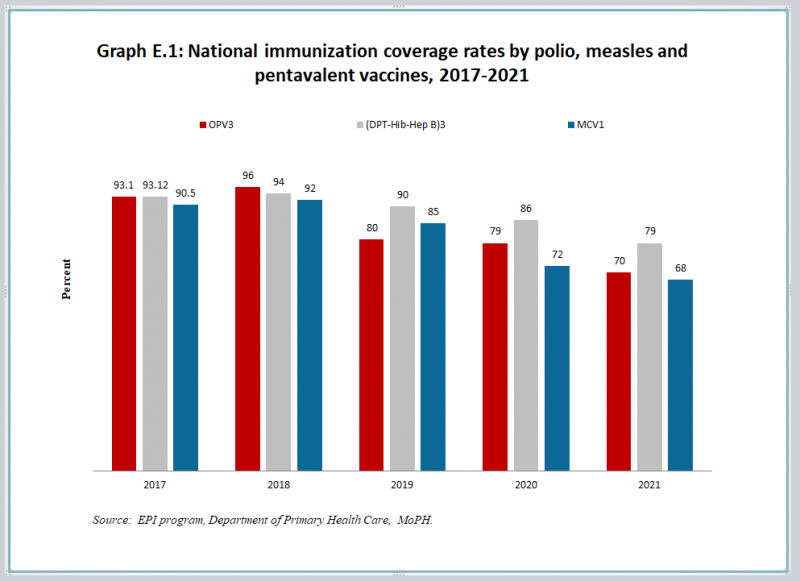
*For previous years check the Statistical Bulletins' page
.PNG)
Download the new version of the MOPH app
for the latest updates on Coronavirus.
The new version of the MOPH APP will provide you with all the reliable information on COVID-19 with ongoing update of the confirmed cases and data. If you are showing any symptoms, the “Symptoms Checker” will be your self-help guide to assess them.